How affordable are our Affordable Rents?
20 September 2019
by Michael Thorne, Research and Policy Analyst
In 2010, the government radically changed the system of social housing rents. At that time, the standard rents charged by social landlords, known as ‘social rents’, stood at around 50% of market rents. The government removed funding for new social rented homes, and introduced a new rent model: Affordable Rents, which could be set at up to 80% of market rents.
It was a highly controversial move. In some parts of the country, especially London and the South East, market rents are so high that 80% is still very expensive for many households. A lot of housing associations did everything possible to keep their affordable rents below 80%, as we discussed in our recent research paper.

We want to be more transparent about how we set rents and how much our homes cost to rent. This blog is part of that project. It explains how high our Affordable Rents are compared to market rents in London and East Hertfordshire.
Michael Thorne, Research and Policy Analyst
Affordable Rent in London
We set our Affordable Rents in different ways depending on the circumstances, as our new rent policy summary explains. But we manage to make our average Affordable Rents lower than 80% of market rents.
In London, our average Affordable Rents are 66% of market rents for one and two bed homes, and 50% of market rents for three beds, as this table shows.
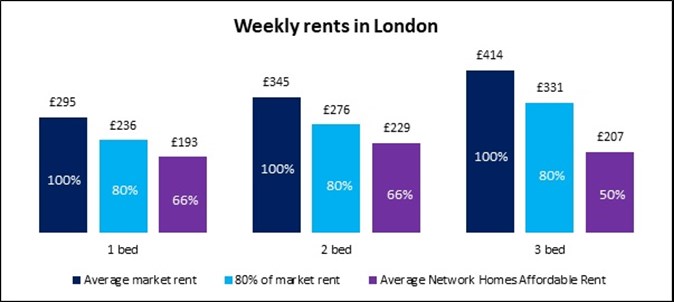
Since 2015, half of new Affordable Rent homes funded by the Greater London Authority have had to be set at around 50% of market rents. This is an important policy which has kept Affordable Rents in London below 80% of market rents. Again, our rent policy summary gives more information about this.
Affordable Rent in East Hertfordshire
In East Hertfordshire, where a quarter of our homes are based, our average Affordable Rents are still under 80% of market rents, but slightly higher as a proportion of market rents than in London. This is mainly because market rents are much higher in London than in East Hertfordshire, so the percentage needs to be lower in London to make rents affordable.
Even though the percentages for East Hertfordshire are higher than in London, our average Affordable Rents in East Hertfordshire are lower than in London, in terms of the actual amounts charged.
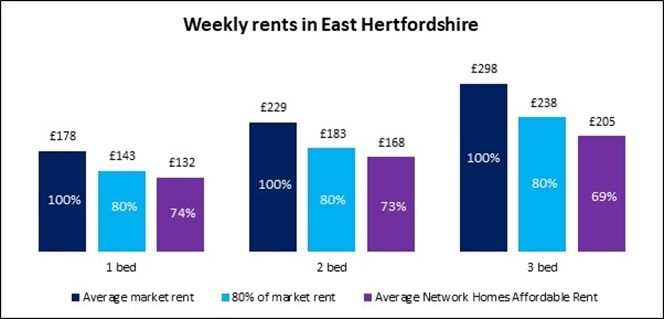
Of course, these are regional averages which do not show how rents vary at different locations. But they give a general picture.
Affordable Rent at new builds
How about rents at new build homes? Since April 2017 we’ve built 303 homes for Affordable Rent. This table gives a breakdown of how the current rents at these homes compare with average market rents in the local authority. While some of these rents are close to 80%, most are below 70%.
|
Local Authority |
Beds |
% of market rents |
|
East Herts |
1 |
78% |
|
2 |
75% |
|
|
3 |
73% |
|
|
Brent |
1 |
67% |
|
2 |
70% |
|
|
3 |
51% |
|
|
Tower Hamlets |
1 |
61% |
|
2 |
53% |
|
|
3 |
44% |
|
|
Ealing |
1 |
62% |
|
2 |
69% |
|
|
3 |
49% |
|
|
Hounslow |
1 |
69% |
|
2 |
73% |
|
|
3 |
N/A |
|
|
Harrow |
1 |
72% |
|
2 |
78% |
|
|
3 |
55% |
The challenge
We know this isn’t perfect. Even when they are below 80% of market rents, Affordable Rents are still very expensive for many households, especially those affected by the benefit cap.
Housing associations face a difficult challenge. Ten years ago, we received over half of the cost to build a new home in government grant. Today we receive less than 12%. But the need to build more homes has never been greater. The income we receive from rents allows us to build new homes to meet this need, as well as to maintain existing homes and improve our services. At the same time, we must make sure our homes are genuinely affordable for those who need them most.
Later this year Network Homes will publish research on how we could re-design the system of social housing rents, to make them simpler, fairer, and more affordable. Watch this space.
For ‘Weekly rents in London’ and ‘Weekly rents in Hertfordshire’: private market data shows Valuation Office Agency (VOA) medians for London by unit bed-size, 2018/19 for London and 2017/18 for Hertford (due to data availability). Network Homes Affordable Rents show Statistical Data Return data for average weekly rents, 2017/18. Larger bed sizes are not shown because VOA data is only available for ‘4 or more bedrooms’. This does not allow for meaningful comparison, since there may well be substantial differences between the composition of stock in this category captured in the VOA measure, and the composition of Network Homes stock in this category.
For table on new builds: ‘% of market’ compares: (a) mean Network Homes rents by local authority and bed count, among homes built since April 2019; (b) VOA median private rents by local authority and bed count. Network Homes rents were current as of July 2019. VOA data is 2018/19 for London and 2017/18 for East Hertfordshire (due to data availability).