BLOG: Why do we sell homes on the open market? - By Michael Thorne and Cameron Anterkyi
30 March 2020
As well as building homes for sub-market rent and shared ownership, we also sell some of the homes we build on the open market, otherwise known as homes for private sale. This has become relatively common among housing associations in recent years, but it is often criticised. Some newspapers claim that selling homes on the open market shows that housing associations are losing their social purpose.
Our social purpose is at the heart of what we do, and it is right to question activities which seem to go against it. We want to do better at explaining why we build homes for private sale and be more transparent about this part of what we do. This blog explains our private sale activity and the reasons behind it.
How many homes do we build for private sale?
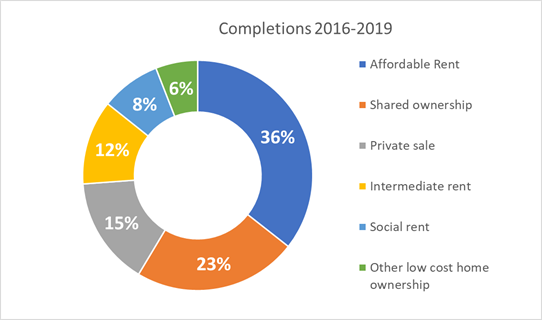
Between 2016 and 2019, 15% of the homes we completed were for private sale. This means they were sold on the open market to the highest bidder. The rest of the homes we built were for sub-market rent, shared ownership, or other forms of low cost home ownership.
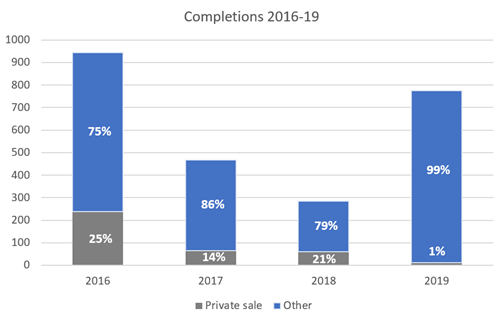
In recent years we have reduced the amount of private sale homes we build, in absolute terms and as a percentage of the homes we build. In 2019, only 1% (11 homes) of the 776 homes we completed were for private sale. The following graph gives the full picture:

Why do we build any private sale homes at all?
We need to sell homes on the open market in order to finance building homes for subsidised rent or sale. We use the profits from private sales to fund building homes of other tenures, for those who are priced out of renting or buying on the open market.
We need to do this because the funding we receive from government for building new affordable homes has reduced dramatically in the past decade. At the same time, build costs have increased. In 2019 we published research showing that:
- The average cost we face in building a new home has increased by 42% in under ten years.
- Meanwhile we now receive on average a third of the grant funding we received ten years ago.
- In 2008, government funding covered over 50% of our costs in building a new home. Now it only covers 12%.
As government funding has reduced and build costs have risen, a gap has emerged. In order to keep building homes for subsidised rent or sale, we need to plug this gap. Selling homes on the open market is the way we do this.
How much do our private sale homes cost?
Prices for our private sale homes are slightly above local average house prices, as recorded by the Office for National Statistics. Our homes sell for slightly more than the average house partly because buyers will pay a premium for newly built homes. There may also be differences in the size and specification of our homes compared to the local average. While we set the asking price, the final price of our homes is ultimately determined by the market.
This graph shows the four schemes where we have sold private sale homes in the last four financial years. For each scheme and year, it shows the average price that Network Homes’s private sale homes sold for, and the average house price for the local authority. The numbers above the bars show how many homes were sold at that scheme in that year (years in which no homes were sold at the scheme are left out).
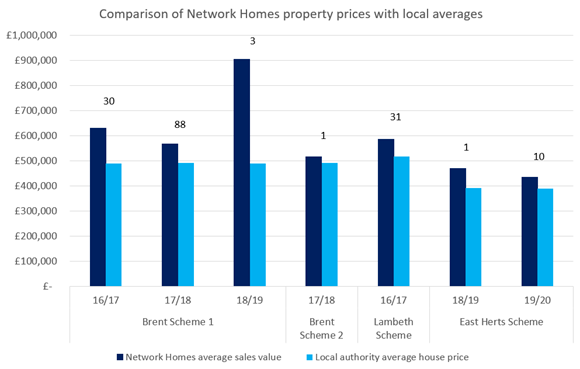
Excluding the three unusually high value homes sold at Brent Scheme 1 in 2018/19, the Network Homes prices shown here are on average 15% higher than the local authority average price.
In general, selling homes on the open market has provided an important source of income which has allowed us to continue building affordable homes in a financially challenging context.
Notes
Completions graphs: intermediate rent includes London Living Rent; other low cost home ownership includes Flexible Affordable Home Ownership, shared equity, equity loan, fixed equity. Graphs ignore five market rent homes completed in 2016.
House price graph uses average local authority house prices from ONS HPI December 2019 release.
The number of private sale homes completed and the number of such homes sold between 2016 and 2019 do not correlate because it can take several years to sell a home. These periods also do not completely overlap since completions data is for calendar years 2016-20 while sales data is for financial years 2016/17-2019/20.